Saint-Vigor-d'Ymonville Résultats de l'élection présidentielle 2017
Les résultats par candidat
54,63 %
EM
E. MACRON
En marche !
45,37 %
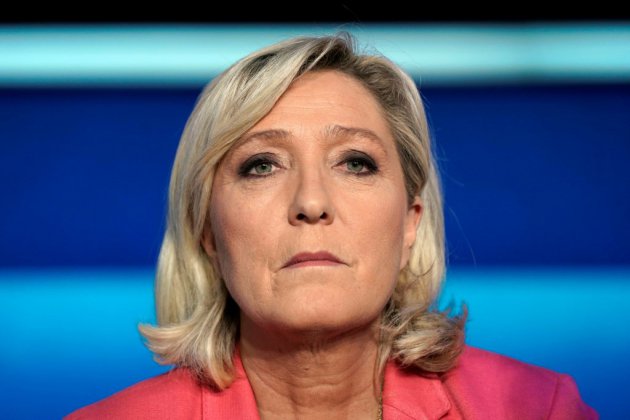
ML
M. LE PEN
Front national
2nd tour
EM
Emmanuel MACRON
En marche !
ML
Marine LE PEN
Front national
Participation
78.11%
Participation
21.89%
Abstention

Inscrits
845 pers.
1er tour
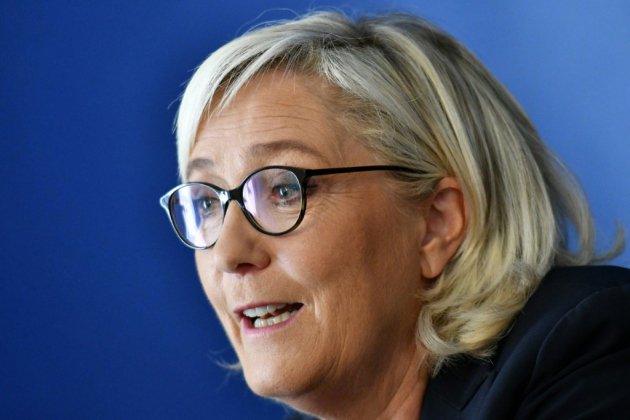
ML
Marine LE PEN
Front national
JM
Jean-Luc MÉLENCHON
La France insoumise
EM
Emmanuel MACRON
En marche !
FF
François FILLON
Les Républicains
BH
Benoît HAMON
Parti socialiste
ND
Nicolas DUPONT-AIGNAN
Debout la France
JL
Jean LASSALLE
Résistons !
Voir plus de candidats
Participation
82.37%
Participation
17.63%
Abstention
Inscrits
845 pers.